
Daily flow
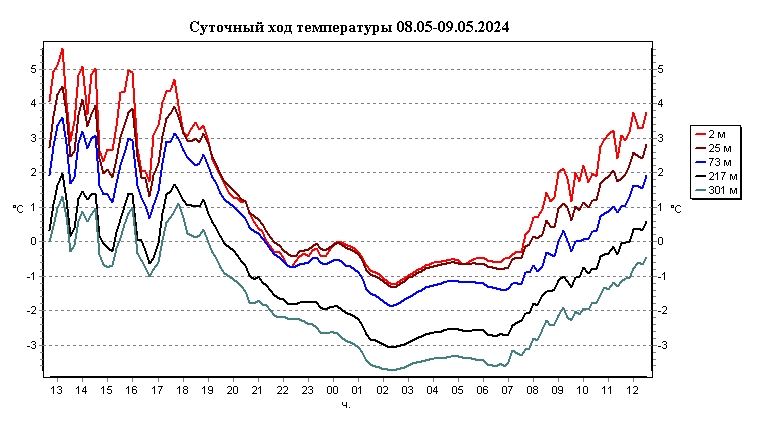
Daily flow of wind velocity, direction and temperature is displayed on this chart. Designation: V - wind velocity, D - wind direction, T - temperature. Different colors represent flows on different altitudes:
| 301 m | 121 m | 8 m |
Averages
10-second10-minute
Graphs & Charts
Daily flowWeekly flow
Altitude profiles
Gauge board
Wind speed and direction at all
Simulations
Transportation modelsArchive
20082009
2010
2011
2012
2013
2014
2015
2016
2017
2018
2019
2020
2021
2022
2023
2024
2025